Linux Provider
Let’s add a HANA Provider to collect metrics for us:
Node Exporter Agent
Before we start, we need to add an agent to the monitored VM.
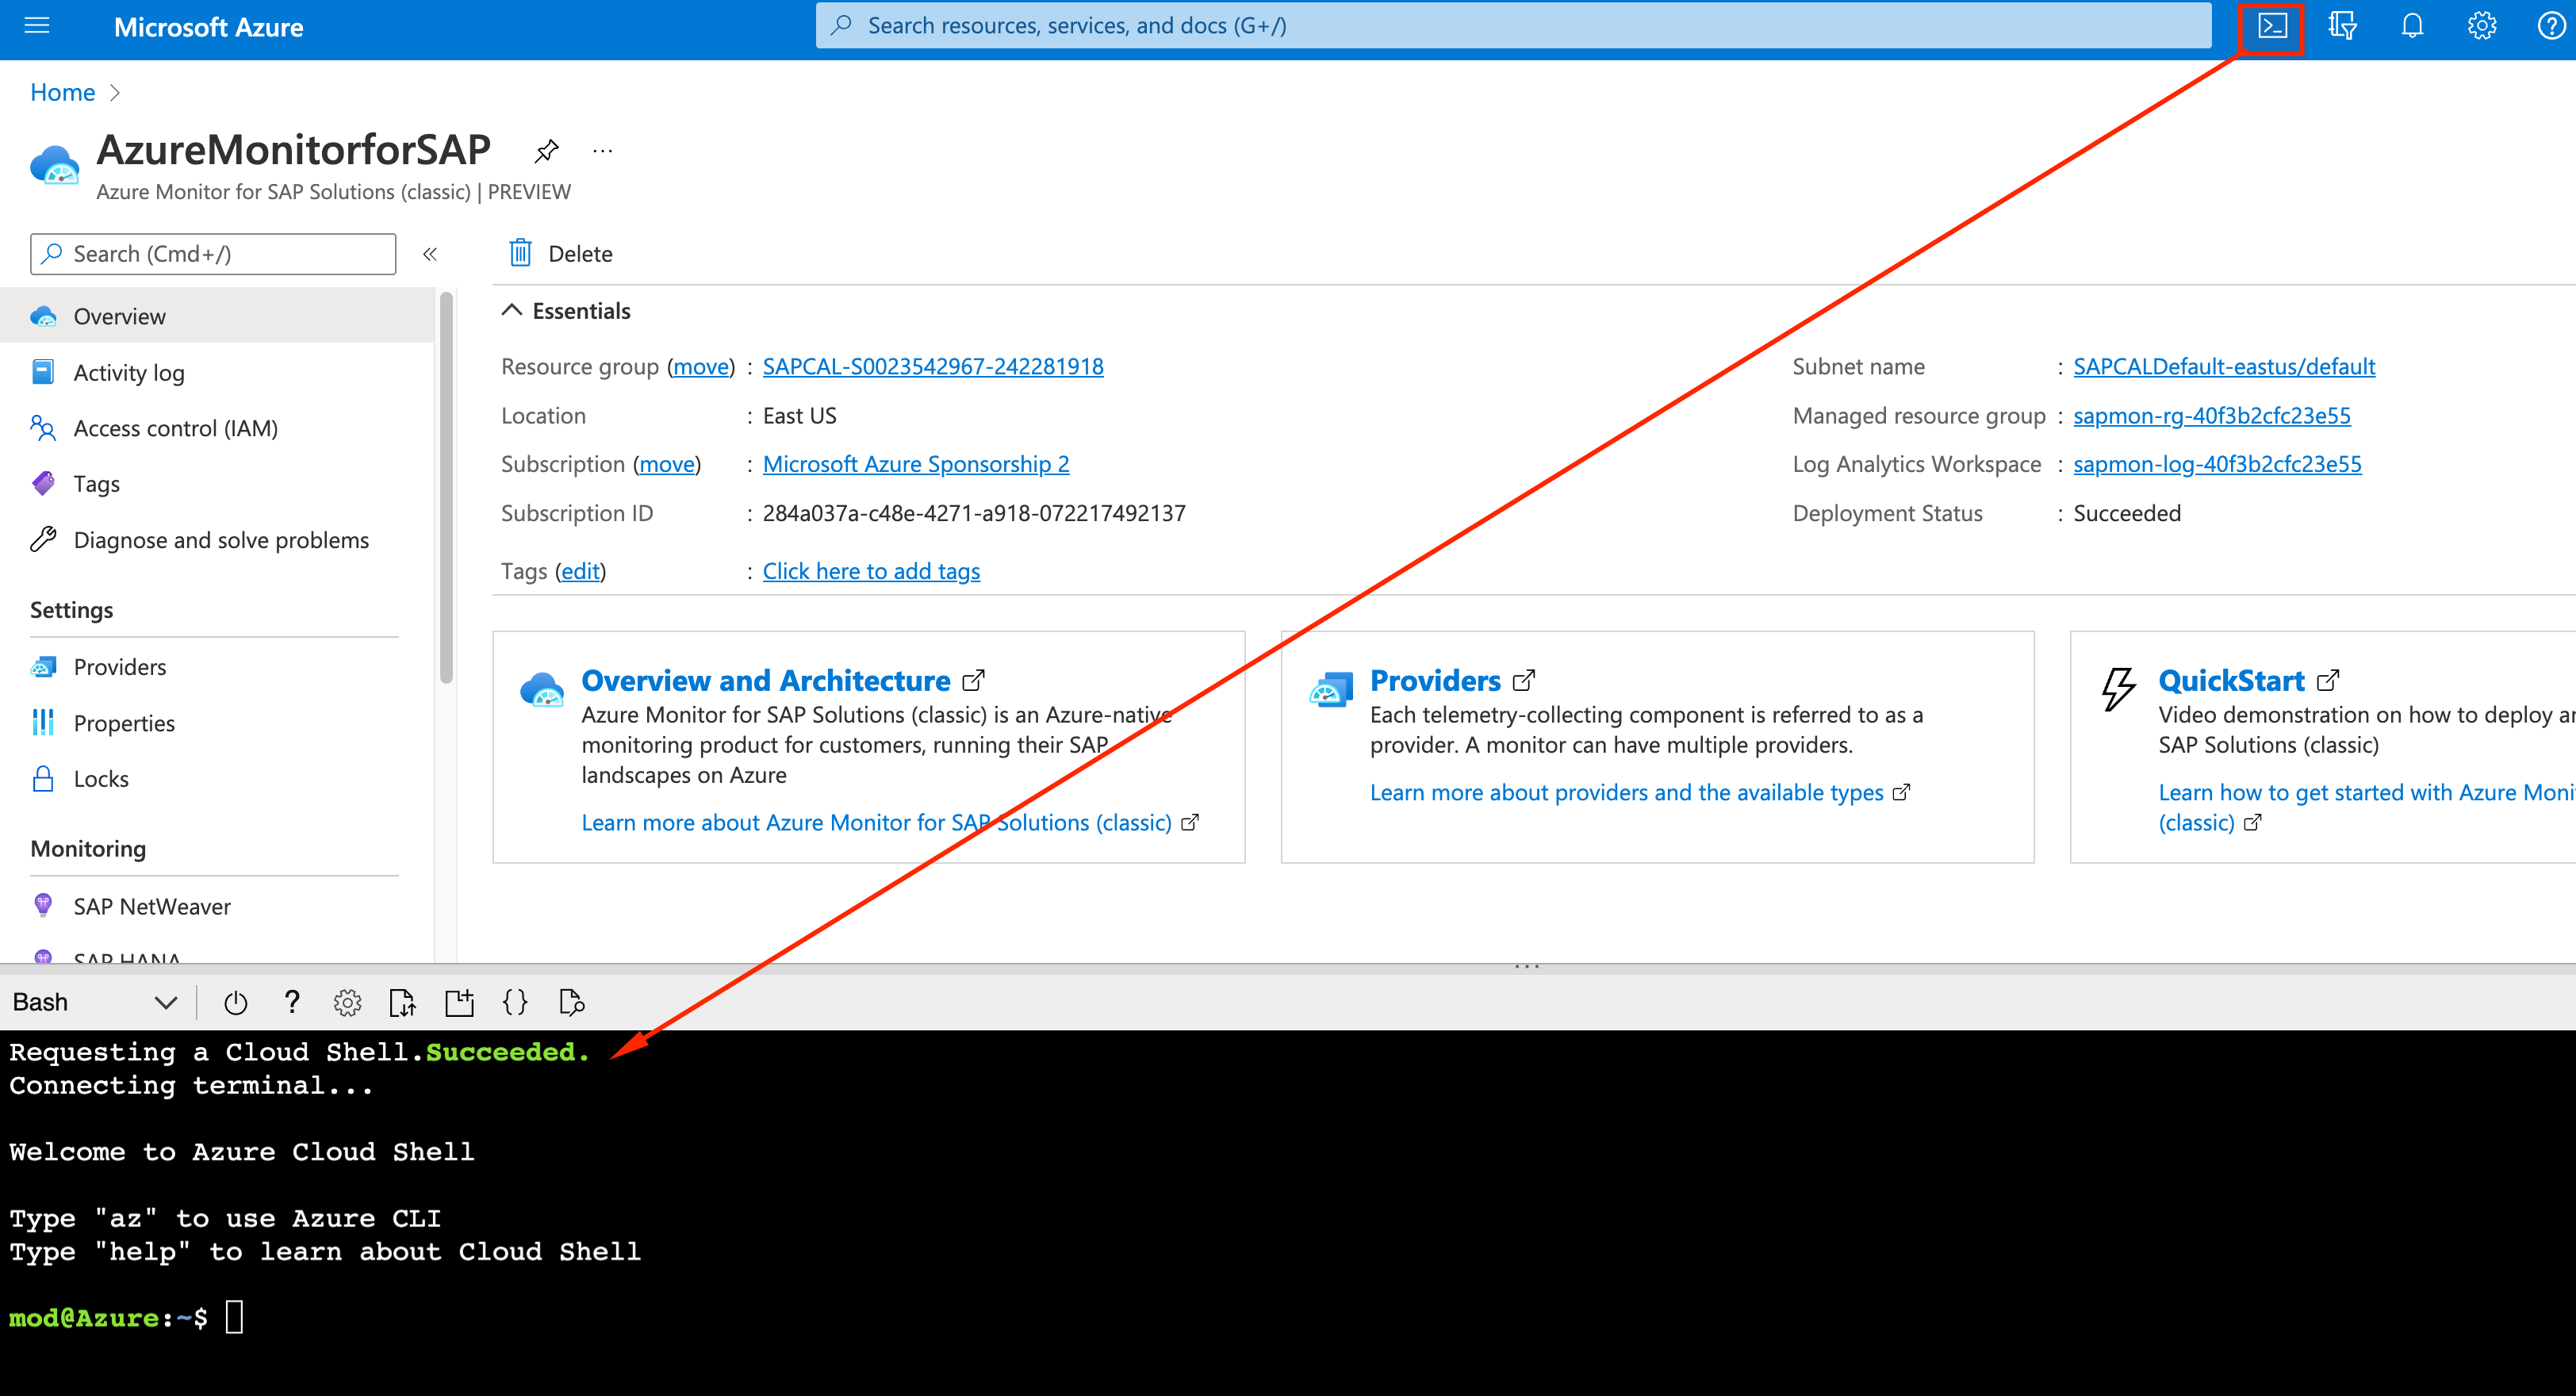
- Go to the Azure Portal and open a Cloud Shell. In the examples we used BASH as the interpreter.
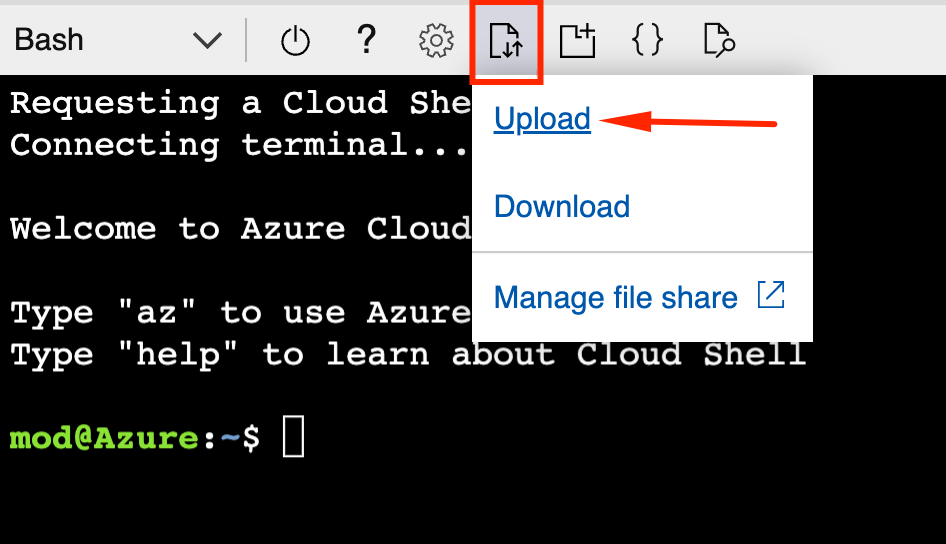
- Now we will upload the key that SAP CAL generated on the deployment so we can log on to the Linux OS. Click on the File Transfer icon and then Upload
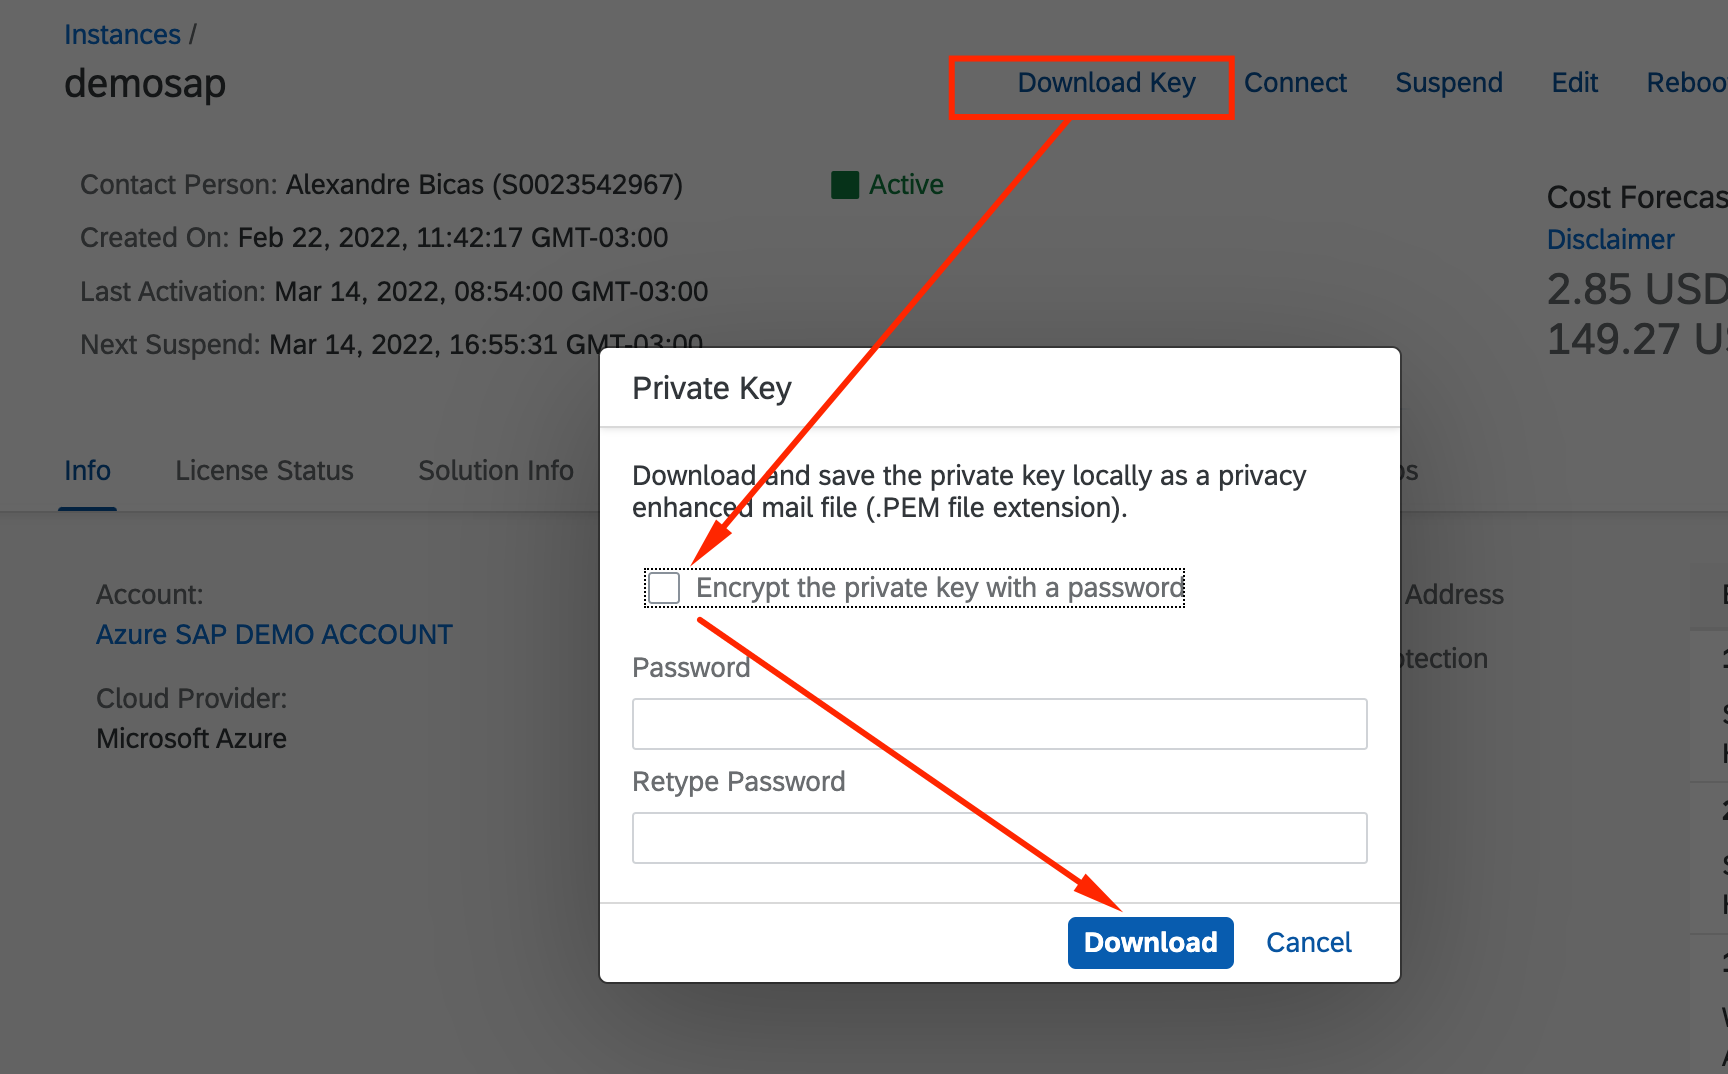
- Select the key which will be a *.pem file, downladed from SAP CAL. If you do not remember or cannot find the file, go to SAP CAL, select your instance, click on Download Key and download it again.
- Let’s add permissions to the .PEM file uploaded on the Azure Cloud Shell (in this example the key is called demosap.pem)
chmod 400 demosap.pem
- With the key setup done, we can connect to the SAP HANA instance, usign the key as password for root:
ssh -i demosap.pem root@<PUBLIC IP of HANA>
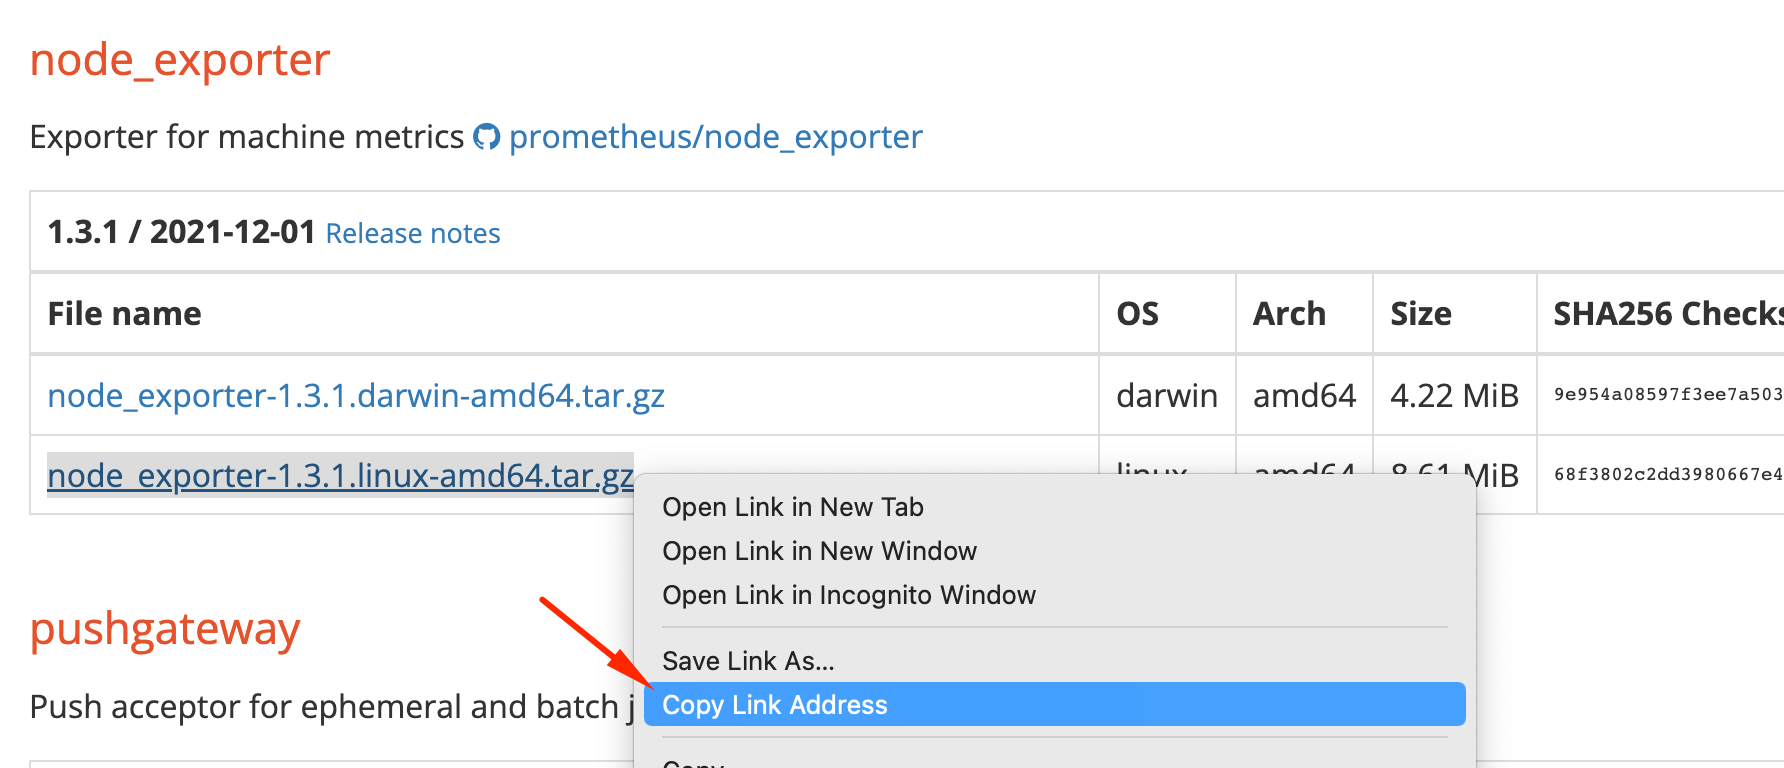
- Let’s download the agent. Go to Prometheus Download Page and copy the address for the latest Node Exporter for Linux
- Back to Azure Cloud Shell, we will download, extract the agent and copy it to /usr/bin.
sid-hdb-s4h:~ # wget https://github.com/prometheus/node_exporter/releases/download/v1.3.1/node_exporter-1.3.1.linux-amd64.tar.gz
sid-hdb-s4h:~ # tar xvzf node_exporter-1.3.1.linux-amd64.tar.gz
node_exporter-1.3.1.linux-amd64/
node_exporter-1.3.1.linux-amd64/LICENSE
node_exporter-1.3.1.linux-amd64/NOTICE
node_exporter-1.3.1.linux-amd64/node_exporter
sid-hdb-s4h:~ # cd node_exporter-1.3.1.linux-amd64/
sid-hdb-s4h:~/node_exporter-1.3.1.linux-amd64 # cp -pr node_exporter /usr/bin/
- Let’s test the agent by invoking it:
sid-hdb-s4h:~ # node_exporter
ts=2022-03-14T18:58:29.764Z caller=node_exporter.go:182 level=info msg="Starting node_exporter" version="(version=1.3.1, branch=HEAD, revision=a2321e7b940ddcff26873612bccdf7cd4c42b6b6)"
ts=2022-03-14T18:58:29.764Z caller=node_exporter.go:183 level=info msg="Build context" build_context="(go=go1.17.3, user=root@243aafa5525c, date=20211205-11:09:49)"
ts=2022-03-14T18:58:29.764Z caller=node_exporter.go:185 level=warn msg="Node Exporter is running as root user. This exporter is designed to run as unpriviledged user, root is not required."
ts=2022-03-14T18:58:29.765Z caller=filesystem_common.go:111 level=info collector=filesystem msg="Parsed flag --collector.filesystem.mount-points-exclude" flag=^/(dev|proc|run/credentials/.+|sys|var/lib/docker/.+)($|/)
ts=2022-03-14T18:58:29.765Z caller=filesystem_common.go:113 level=info collector=filesystem msg="Parsed flag --collector.filesystem.fs-types-exclude" flag=^(autofs|binfmt_misc|bpf|cgroup2?|configfs|debugfs|devpts|devtmpfs|fusectl|hugetlbfs|iso9660|mqueue|nsfs|overlay|proc|procfs|pstore|rpc_pipefs|securityfs|selinuxfs|squashfs|sysfs|tracefs)$
ts=2022-03-14T18:58:29.765Z caller=node_exporter.go:108 level=info msg="Enabled collectors"
ts=2022-03-14T18:58:29.765Z caller=node_exporter.go:115 level=info collector=arp
ts=2022-03-14T18:58:29.765Z caller=node_exporter.go:115 level=info collector=bcache
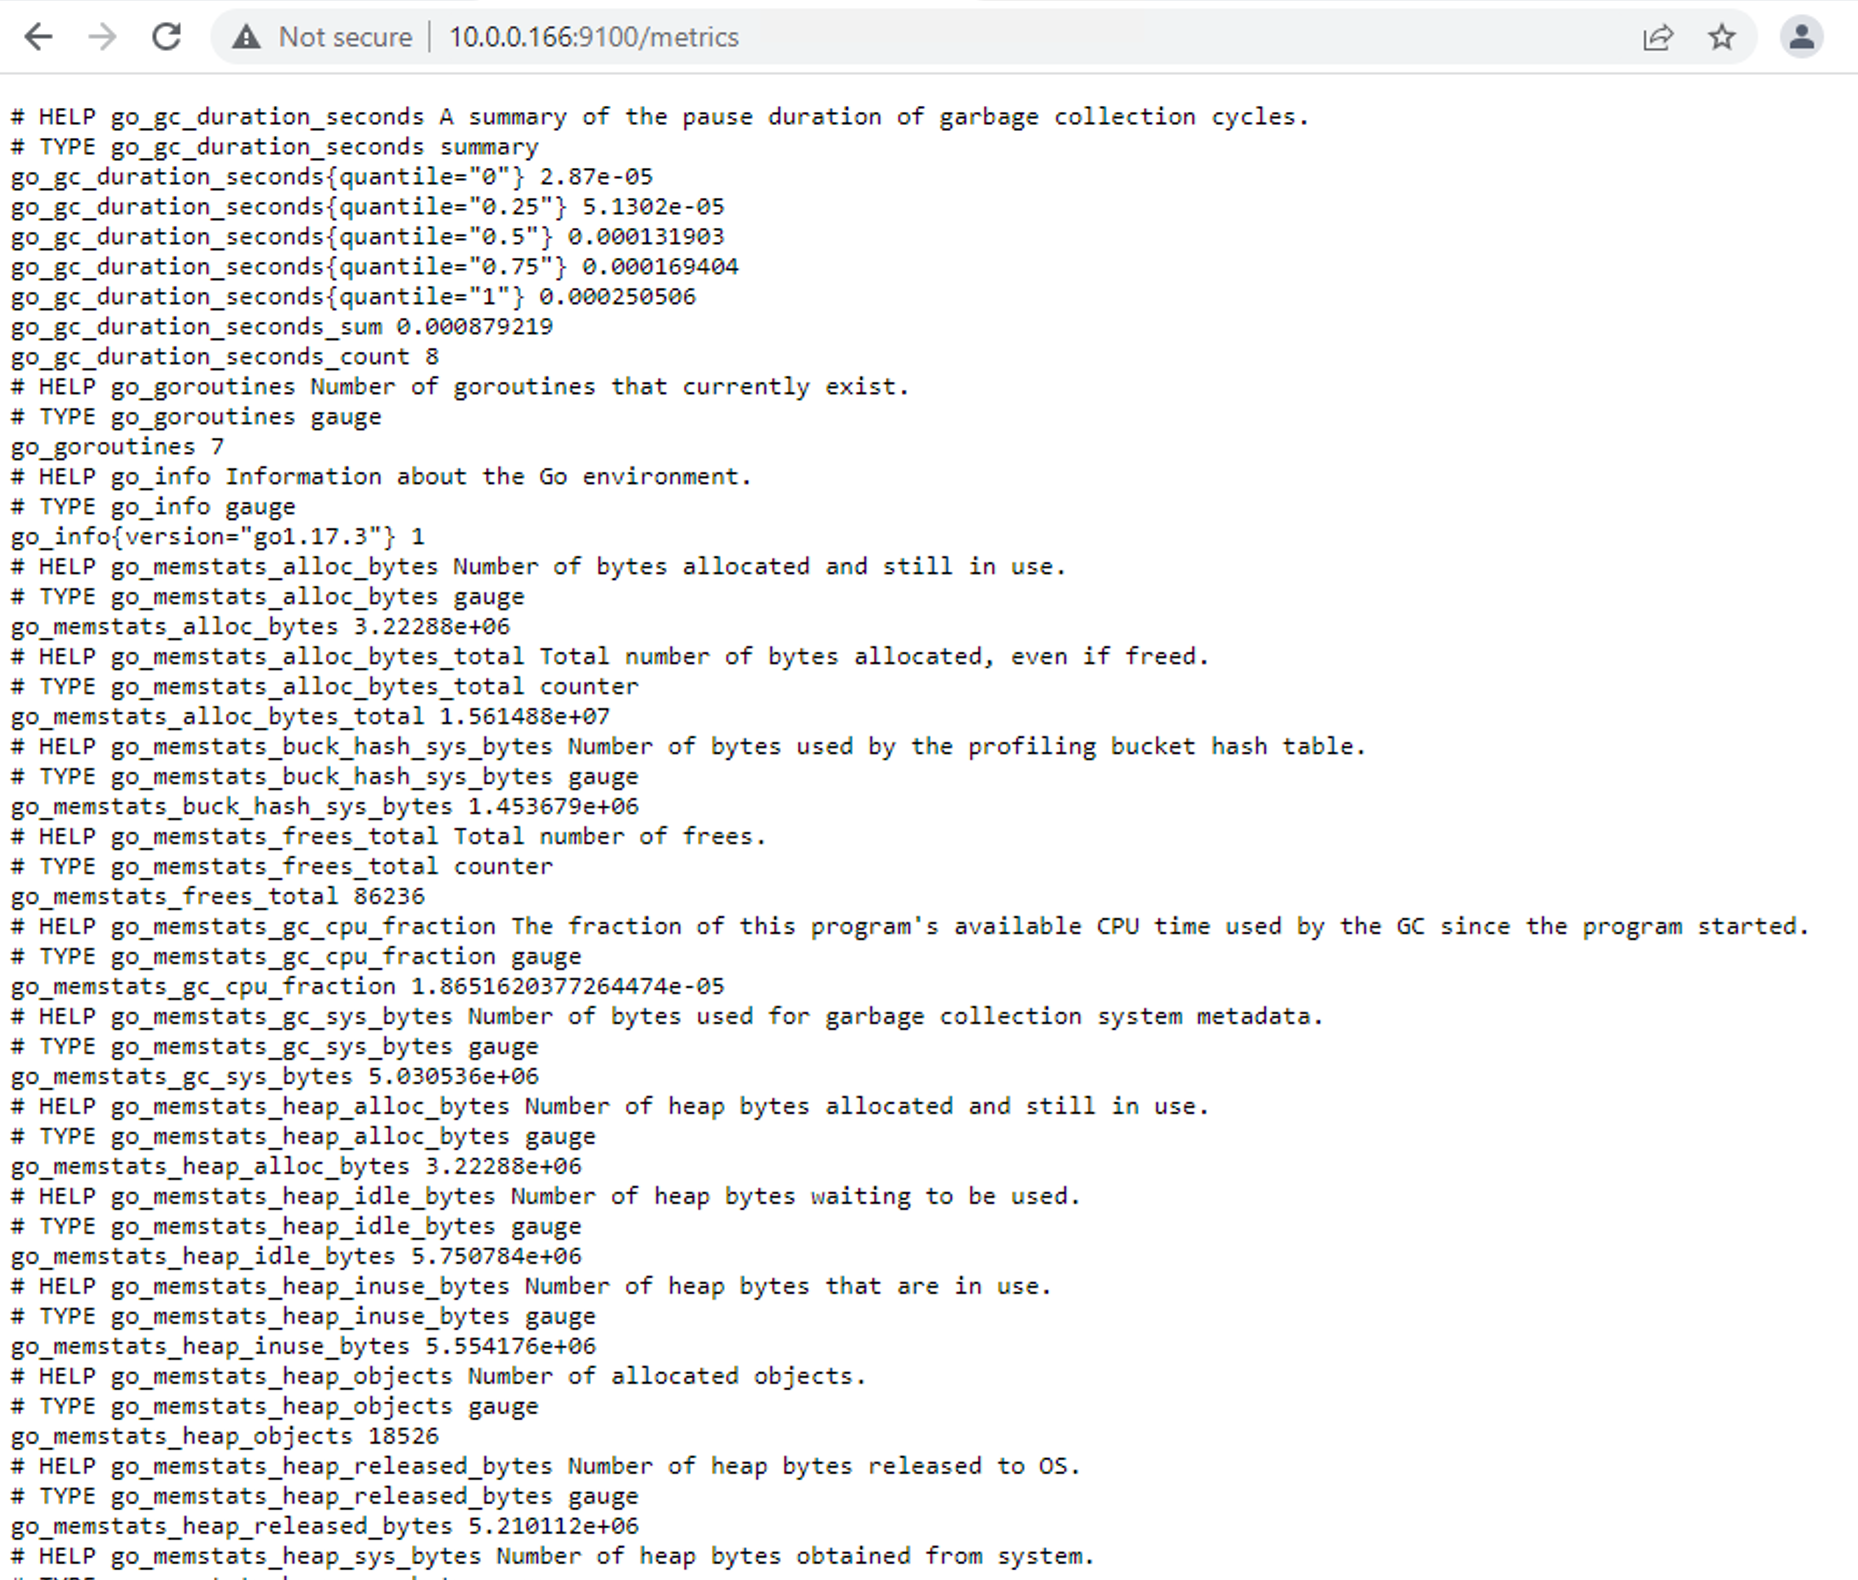
- On the Bastion Host, go to http://«SAP HANA Private IP»:9100/metrics
- Kill the node_exporter process with CTRL+C and start it in background
nohup node_exporter &
The agent is installed and communicating internally on the vNET. Let’s add the provider now
Linux Provider
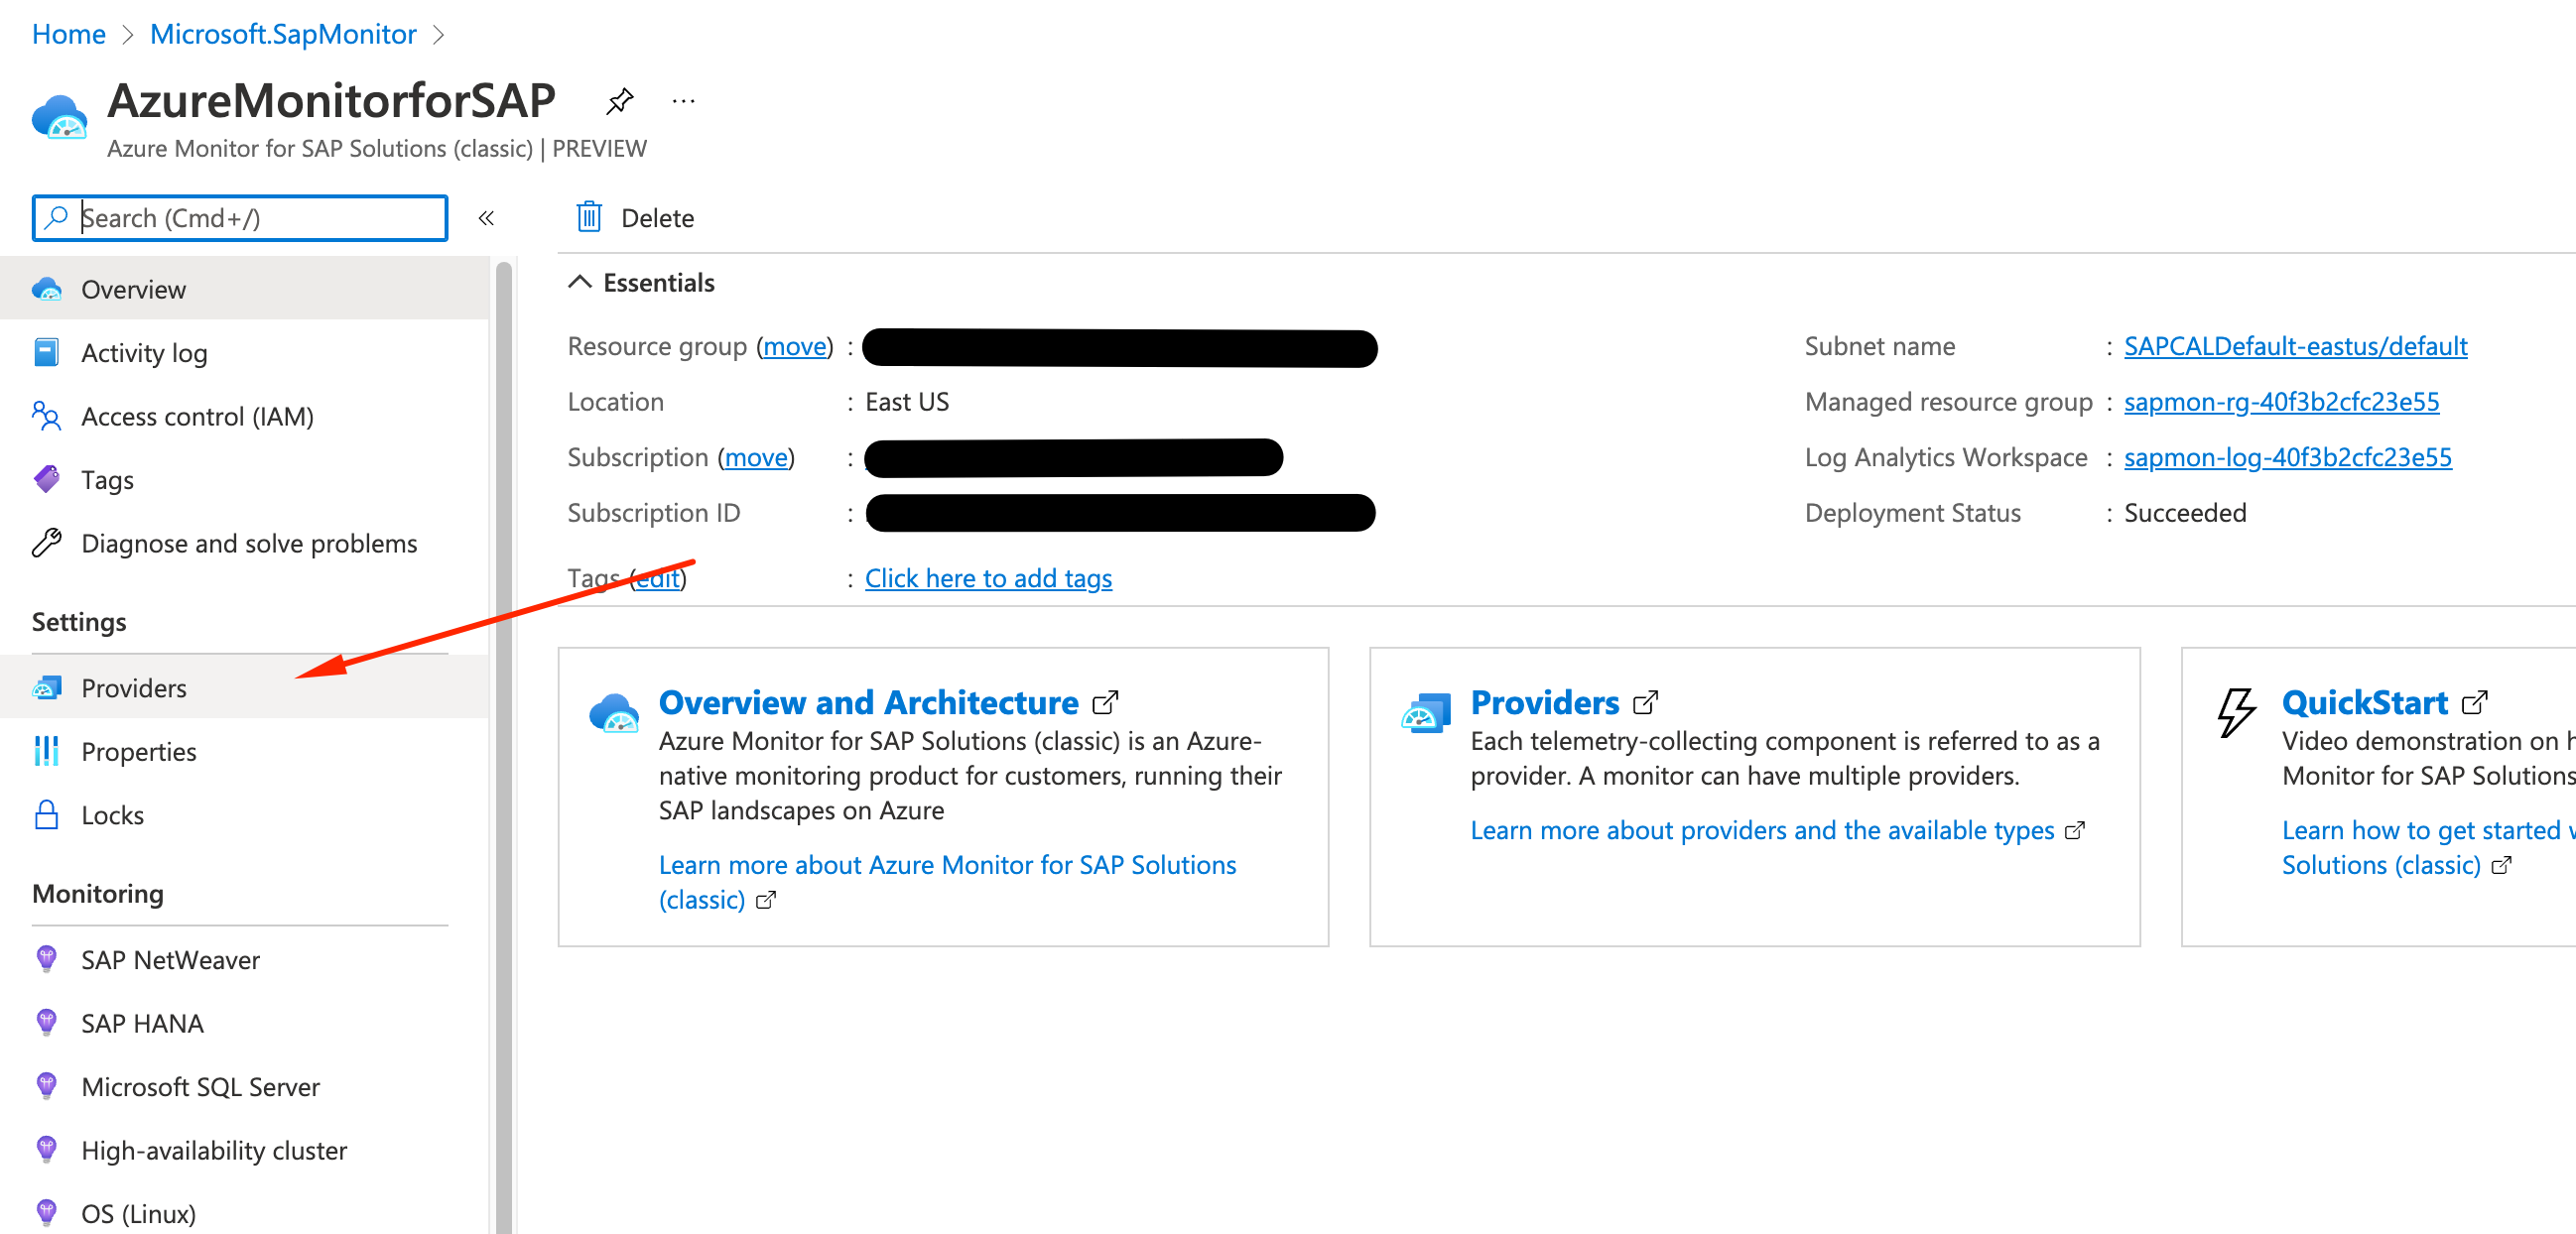
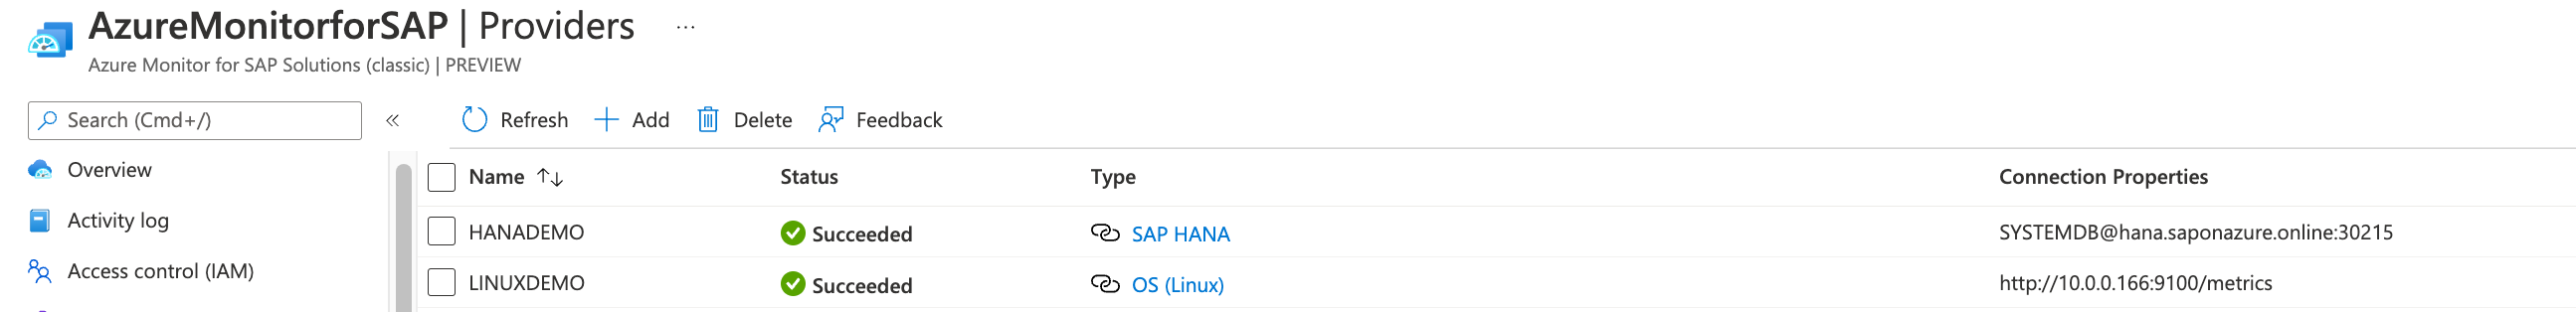
- On the Azure Monitor for SAP, go to Providers
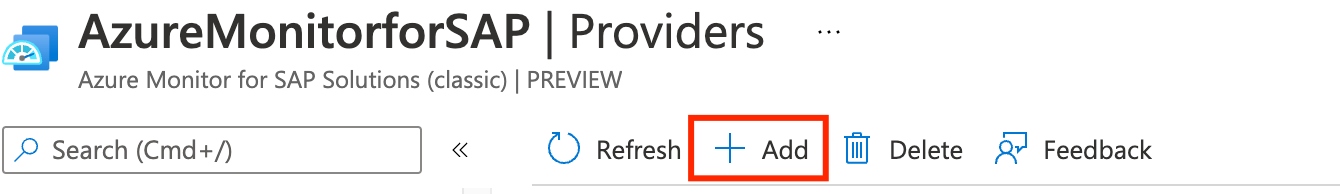
- Click Add
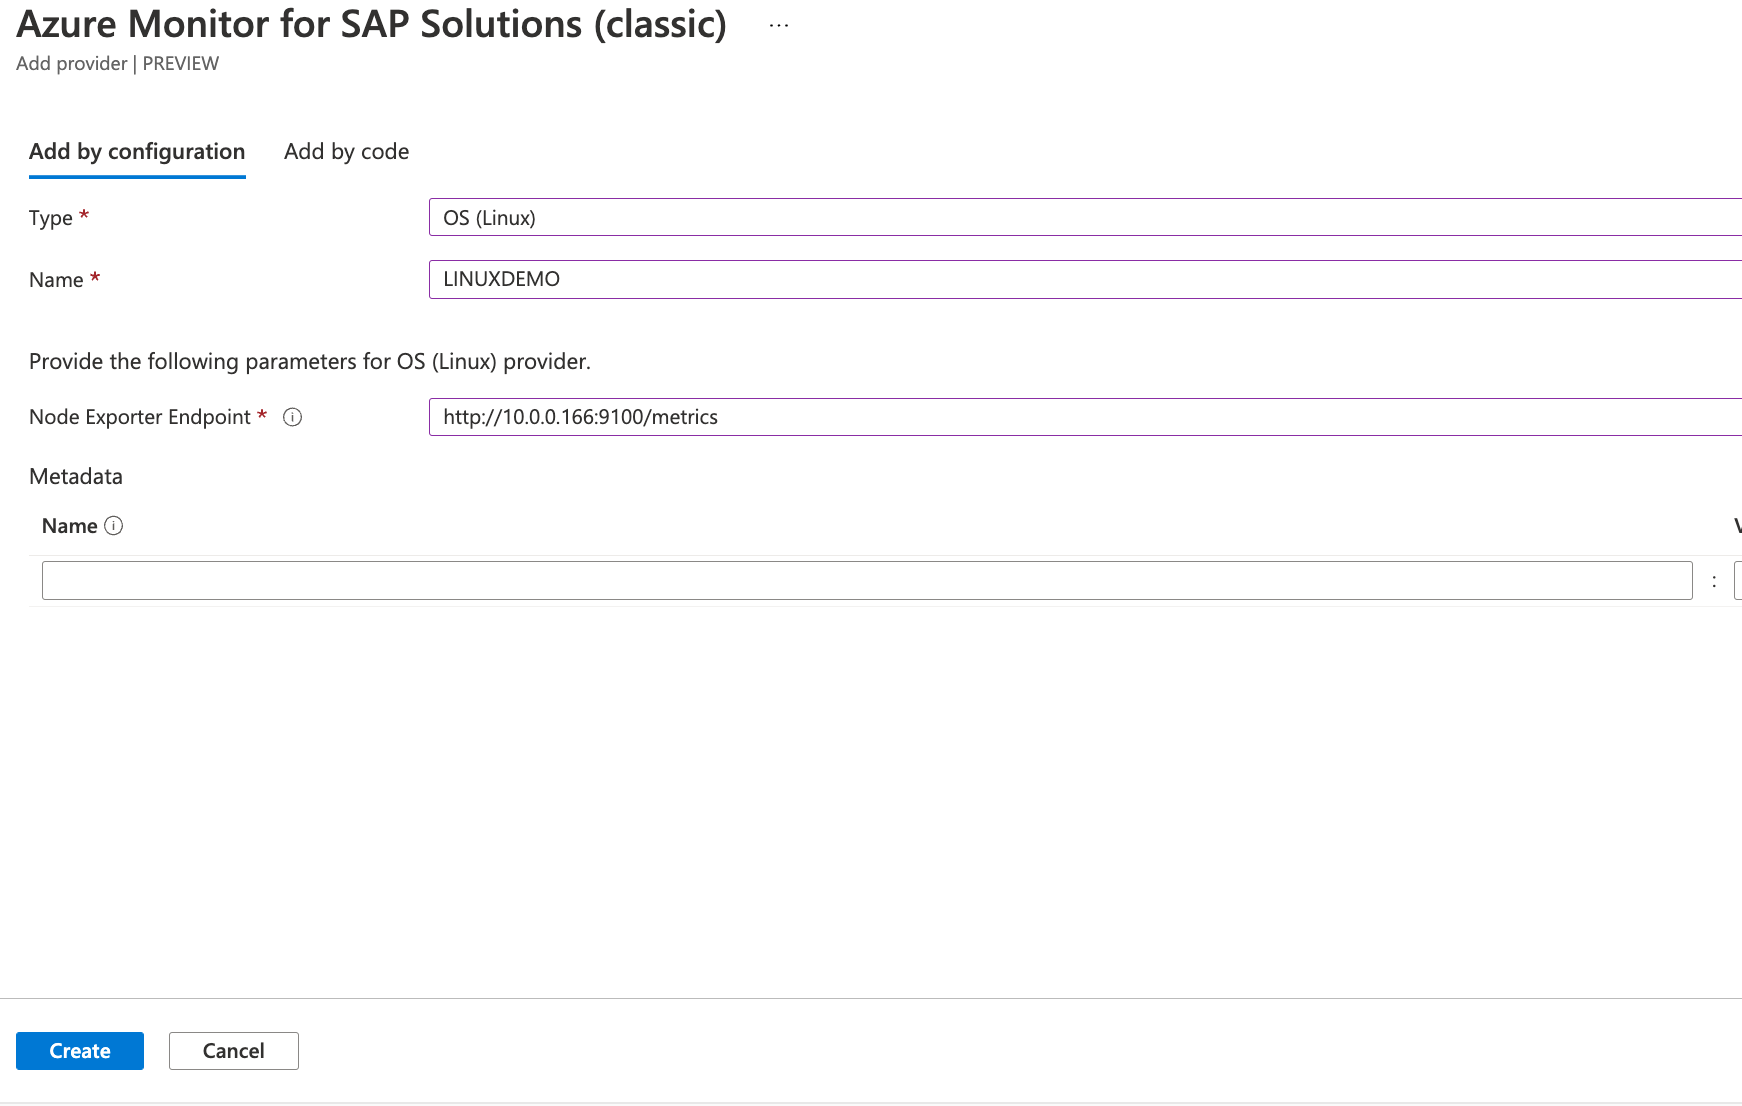
- Let’s fill the required data:
- Type: OS Linux
- Endpoint: http://internal_ip_address:9100/metrics
- Wait until the provider is created and give it 10-15 minutes for data to start to flow.
- Go to Monitoring, select OS (Linux), and pick the host.
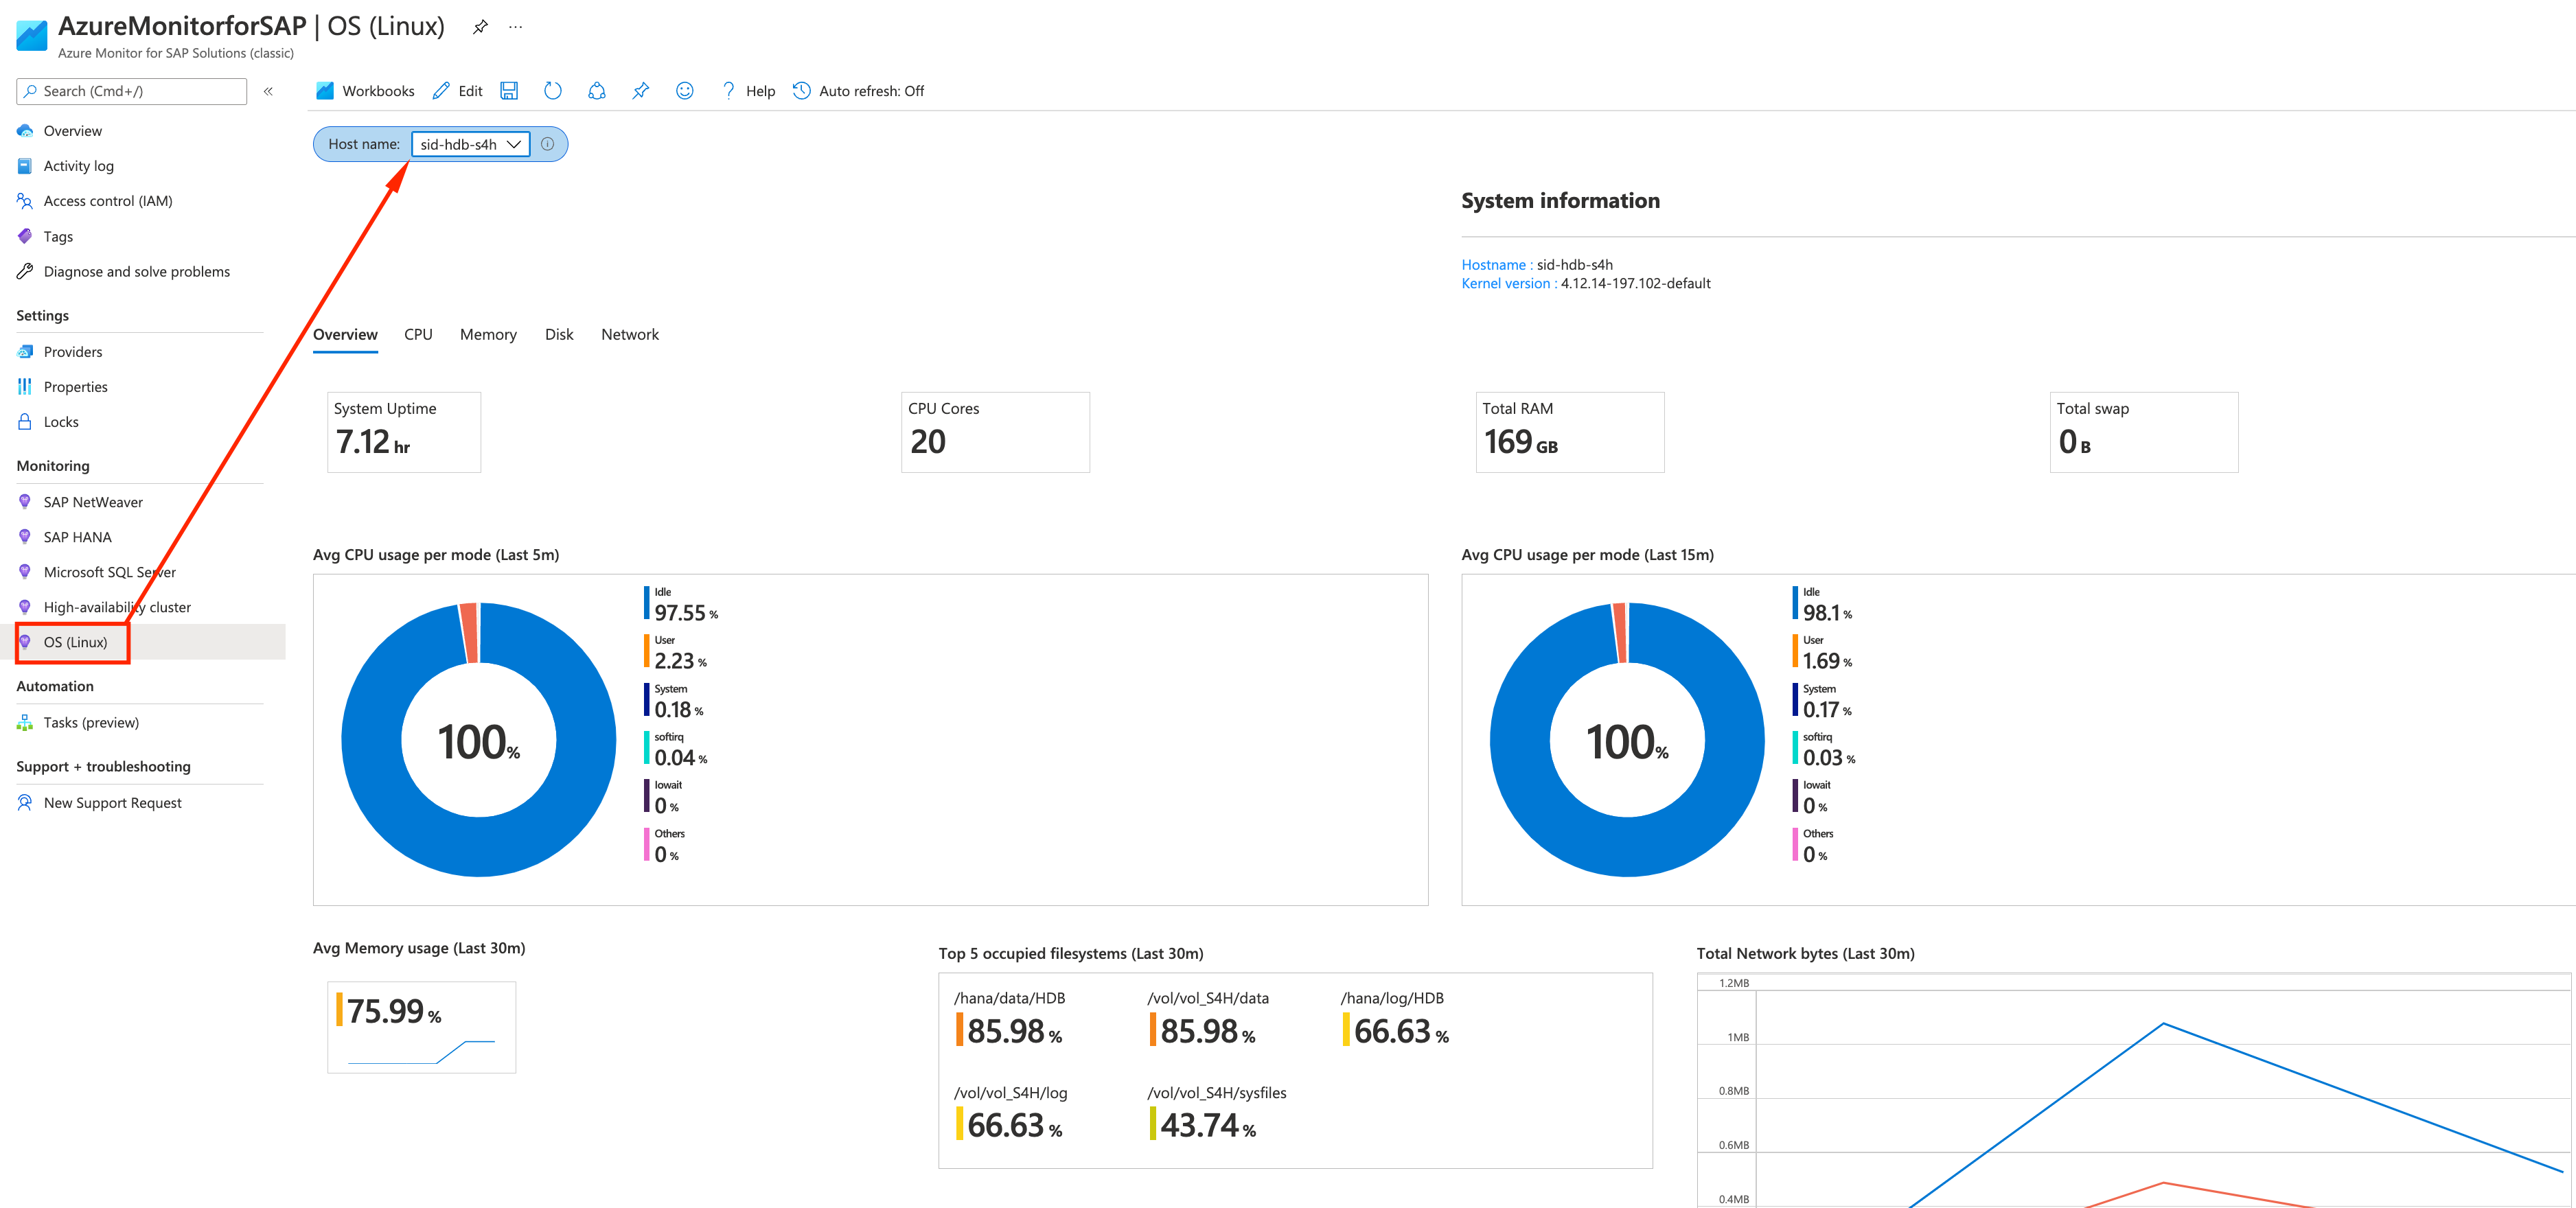
Congratulations, you just installed and finished the OS Linux Agent install.
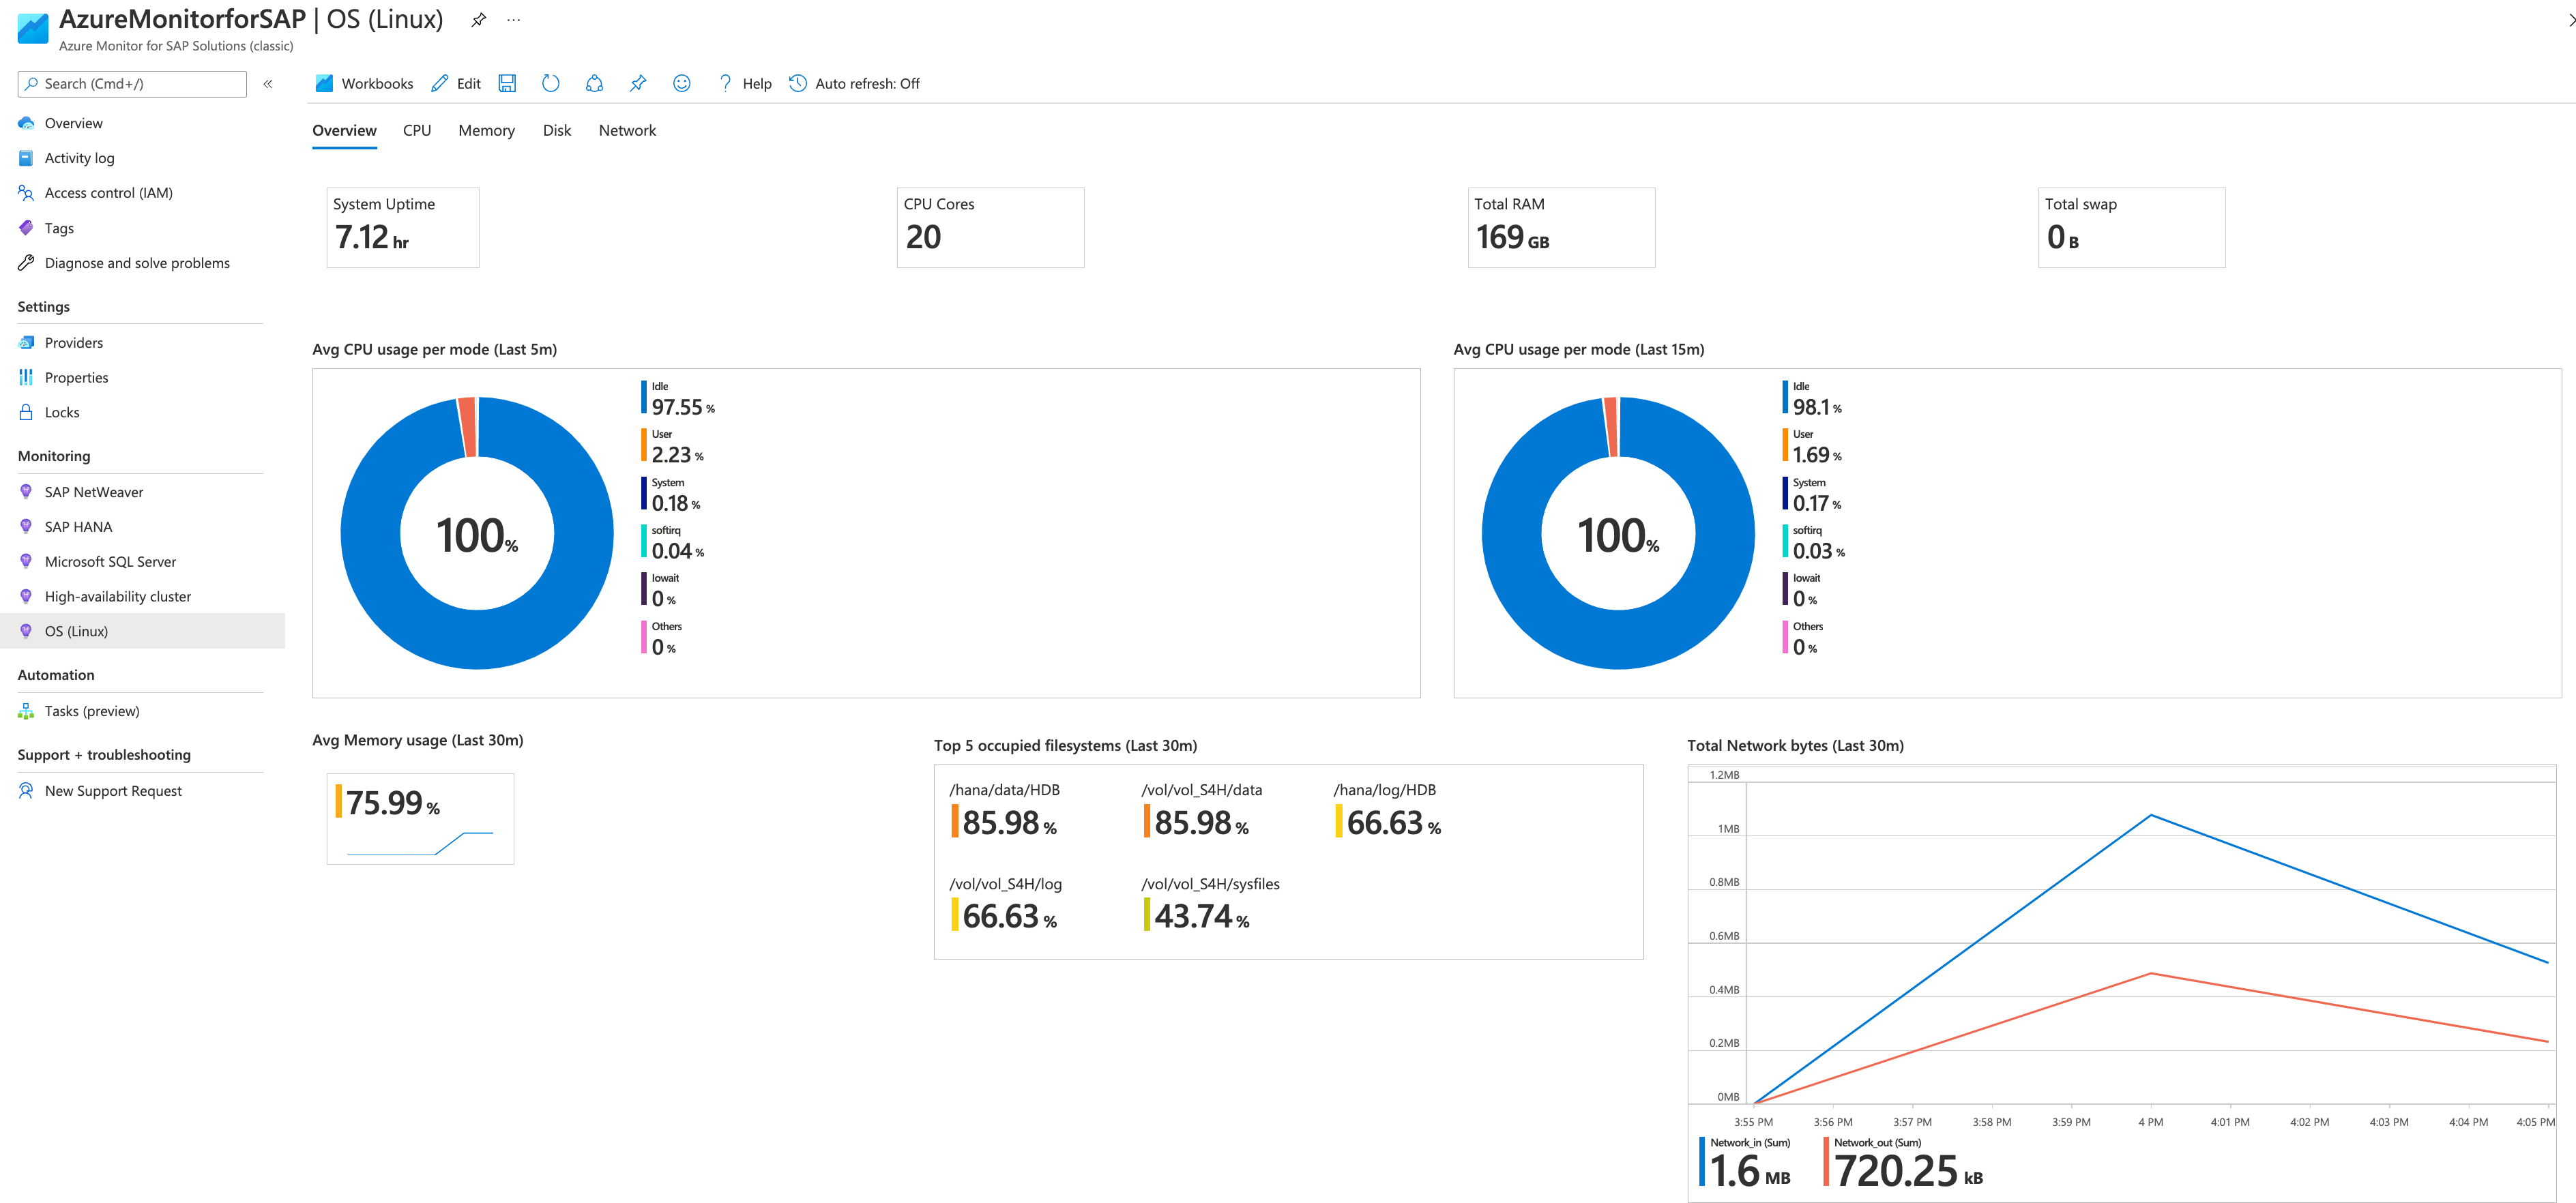
From here on, you should be able to see collected data directly from Linux:
Overview with peak CPU and RAM, disk usage
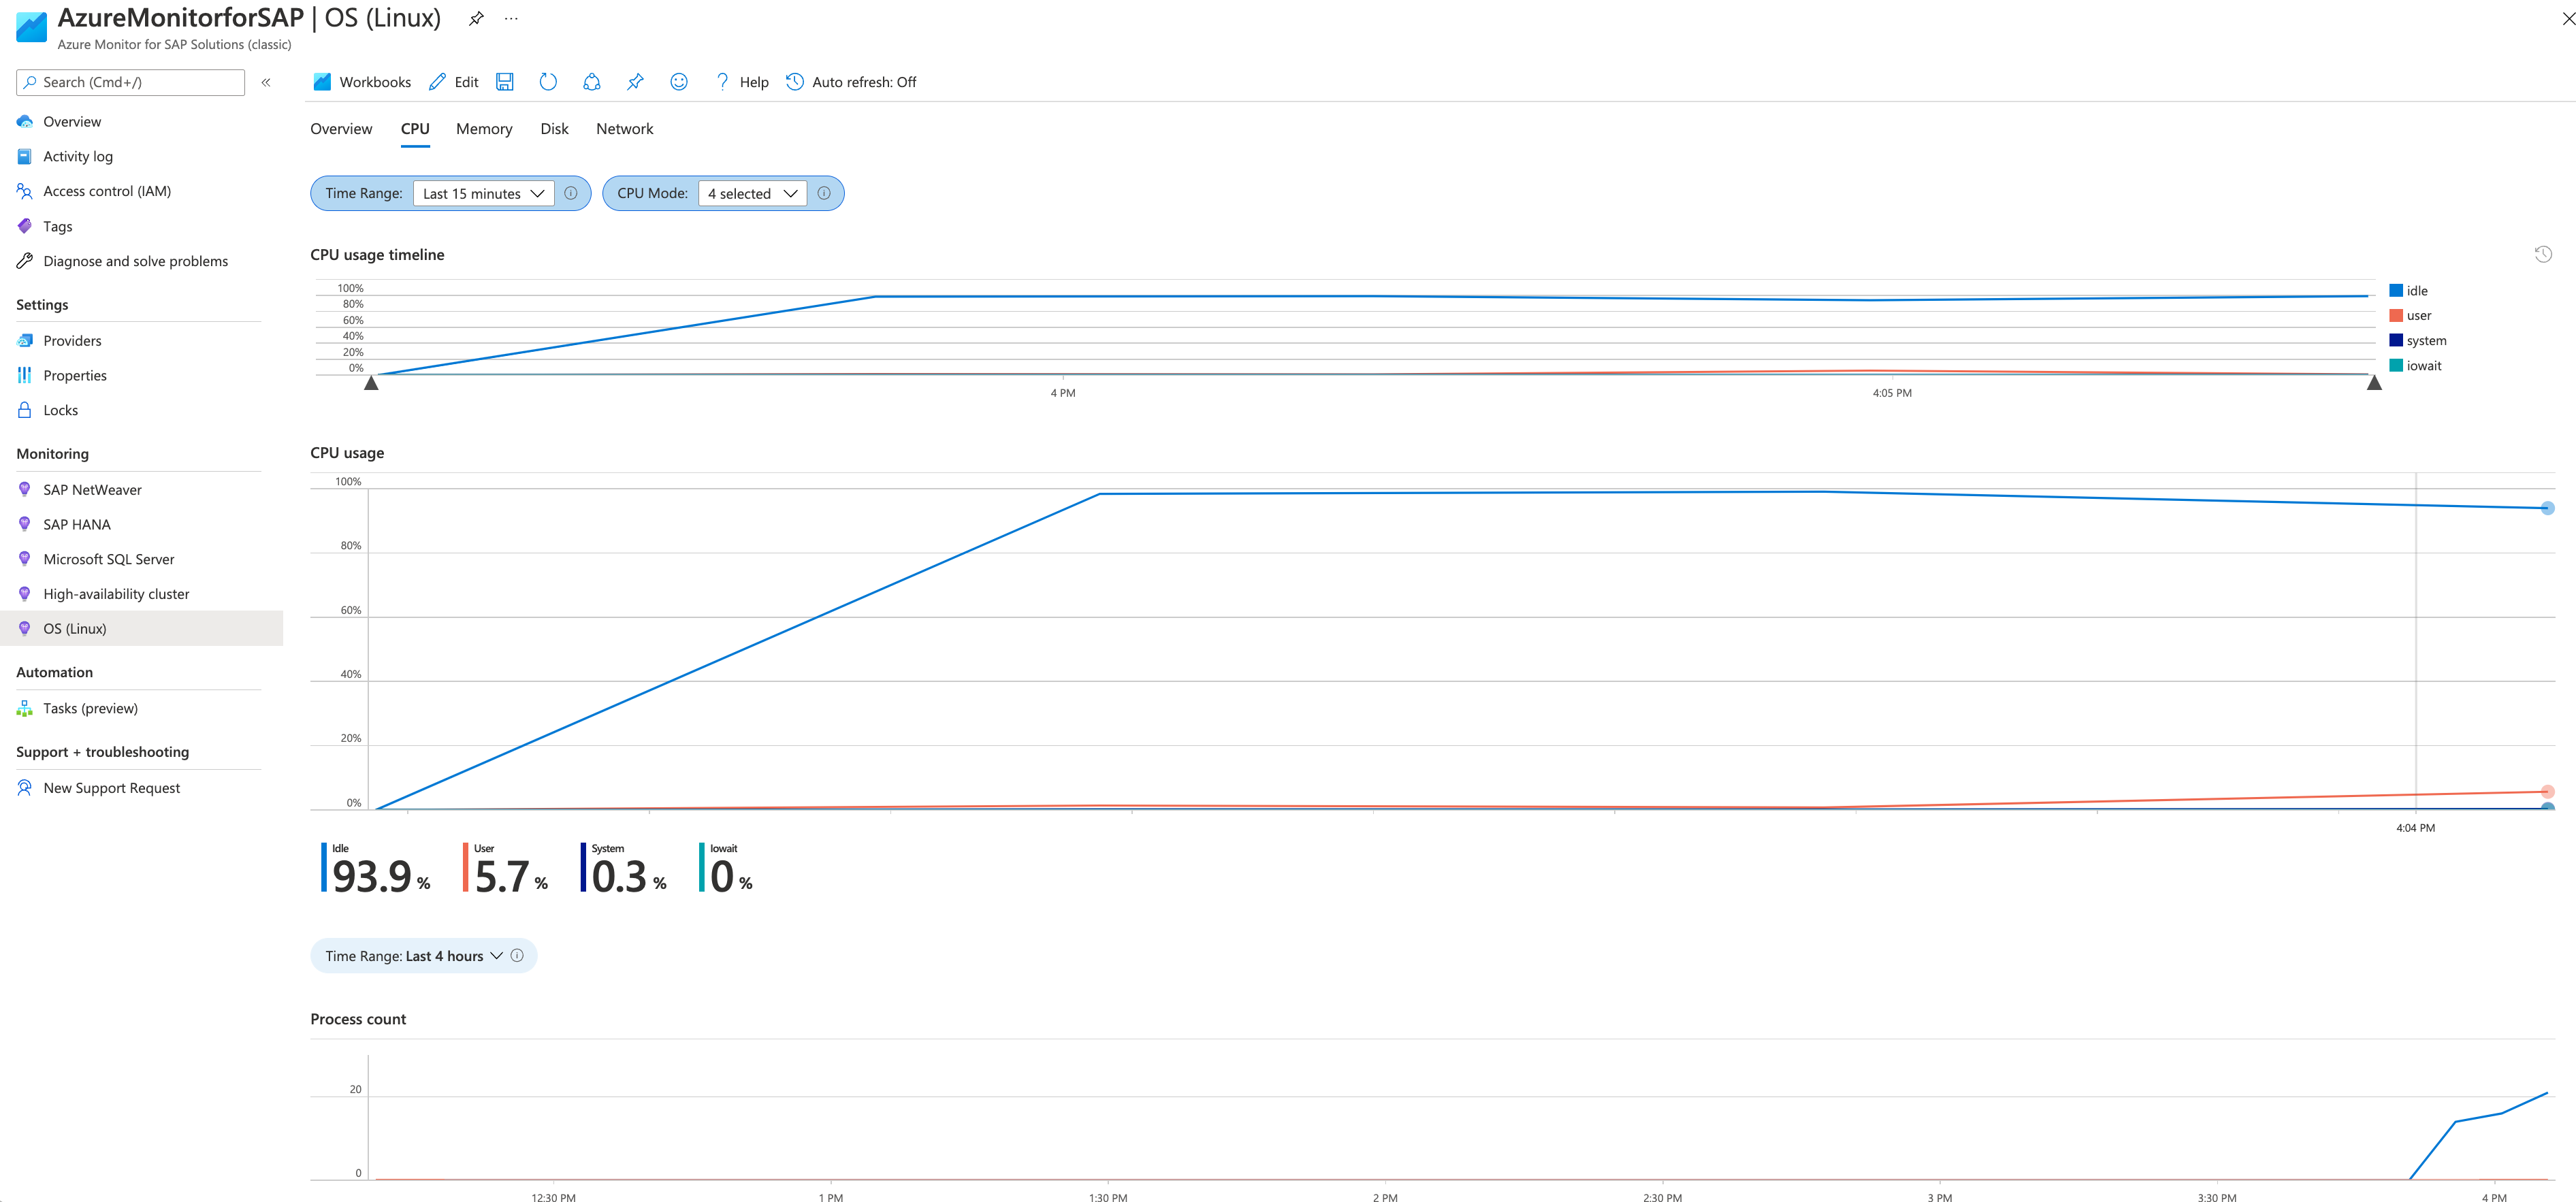
Historic CPU Monitoring
Disk size and growth
