Power BI
What is Power BI ?
Power BI is a collection of software services, apps, and connectors that work together to turn your unrelated sources of data into coherent, visually immersive, and interactive insights. Your data may be an Excel spreadsheet, or a collection of cloud-based and on-premises hybrid data warehouses. Power BI lets you easily connect to your data sources, visualize and discover what’s important, and share that with anyone or everyone you want.
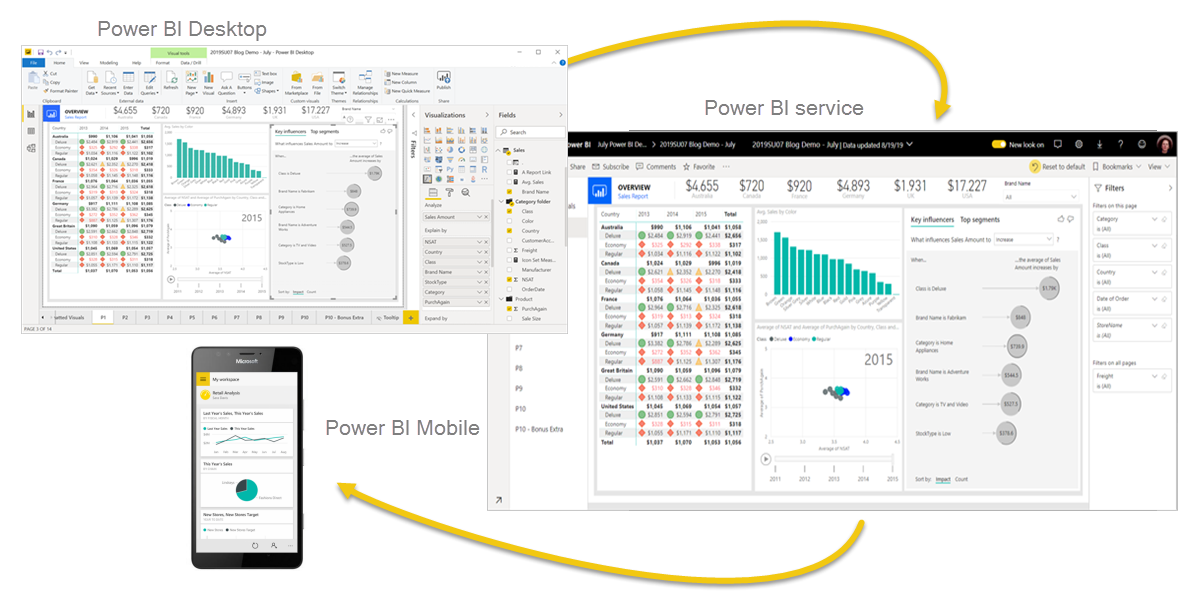
Power BI consists of several elements that all work together, starting with these three basics:
- A Windows desktop application called Power BI Desktop.
- An online SaaS (Software as a Service) service called the Power BI service.
- Power BI mobile apps for Windows, iOS, and Android devices.

How you use Power BI can be based on which feature or service of Power BI is the best tool for your situation. For example, you can use Power BI Desktop to create reports for your own team about customer engagement statistics and you can view inventory and manufacturing progress in a real-time dashboard in the Power BI service. You can create a paginated report of mailable invoices, based on a Power BI dataset. Each part of Power BI is available to you, which is why it’s so flexible and compelling.
One common workflow in Power BI begins by connecting to data sources in Power BI Desktop and building a report. You then publish that report from Power BI Desktop to the Power BI service, and share it so business users in the Power BI service and on mobile devices can view and interact with the report.
What is Power BI Desktop?
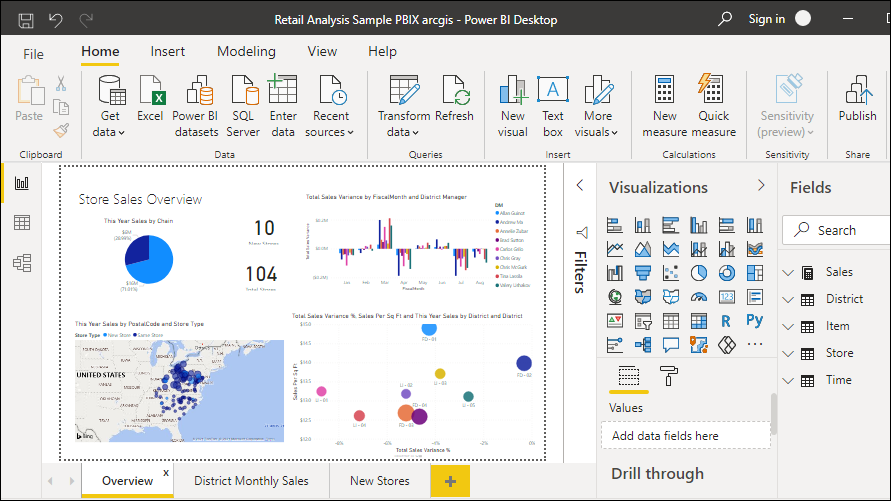
Power BI Desktop is a free application you install on your local computer that lets you connect to, transform, and visualize your data. With Power BI Desktop, you can connect to multiple different sources of data, and combine them (often called modeling) into a data model. This data model lets you build visuals, and collections of visuals you can share as reports, with other people inside your organization. Most users who work on business intelligence projects use Power BI Desktop to create reports, and then use the Power BI service to share their reports with others.

The most common uses for Power BI Desktop are as follows:
- Connect to data
- Transform and clean that data, to create a data model
- Create visuals, such as charts or graphs, that provide visual representations of the data
- Create reports that are collections of visuals, on one or more report pages
- Share reports with others by using the Power BI service
What we will build
In this lab we will import a demo database to SAP HANA and then build visualizations on top of this data.
The video below shows the examples we will build, using realtime SAP HANA data to build powerfull reports with insightfull drill downs.
Estimated Time for this Lab
This lab is estimated to take between 60 minutes.
Requirements
For this demo we will be using the following components from the Environment Setup:
- S/4HANA deployed from SAP CAL
- Azure subscription